Reporting Graphs
Contains information about the graphs displayed on the Reporting screen in FreeCORE.
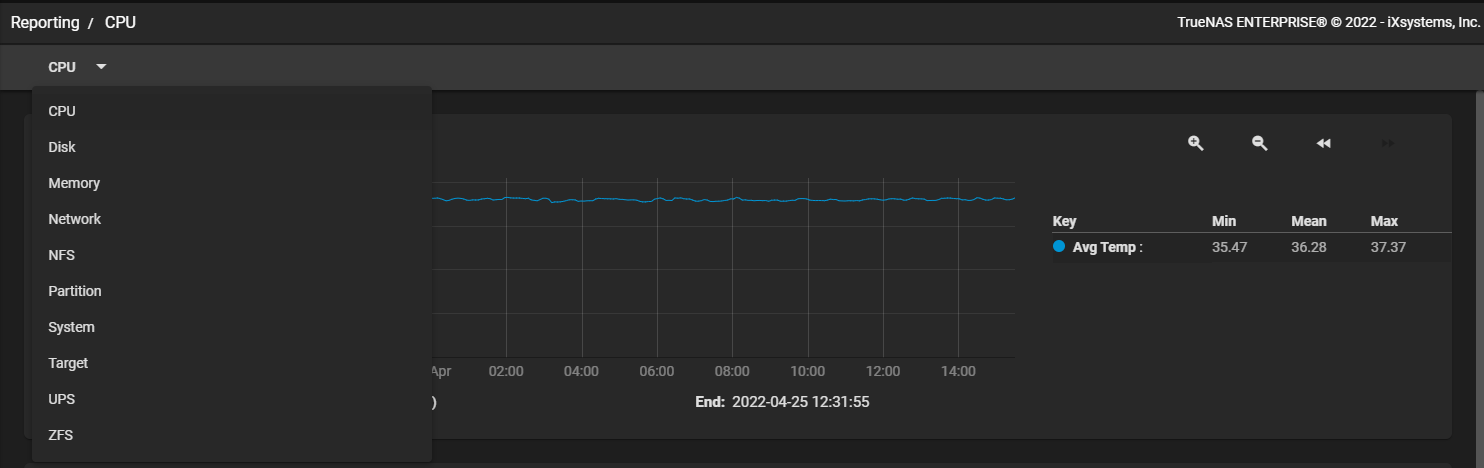
The Reporting screen displays graphs of system information for CPU, disk, memory, network, NFS, partition, target, UPS, ZFS, and system functions.
Reporting data is saved to permit viewing and monitoring usage trends over time. This data is preserved across system upgrades and restarts.
Data files are saved in /var/db/collectd/rrd/.
Important
Because reporting data is frequently written it should not be stored on the boot pool or operating system device.
Reporting Screen Display Options
| Setting | Description |
|---|---|
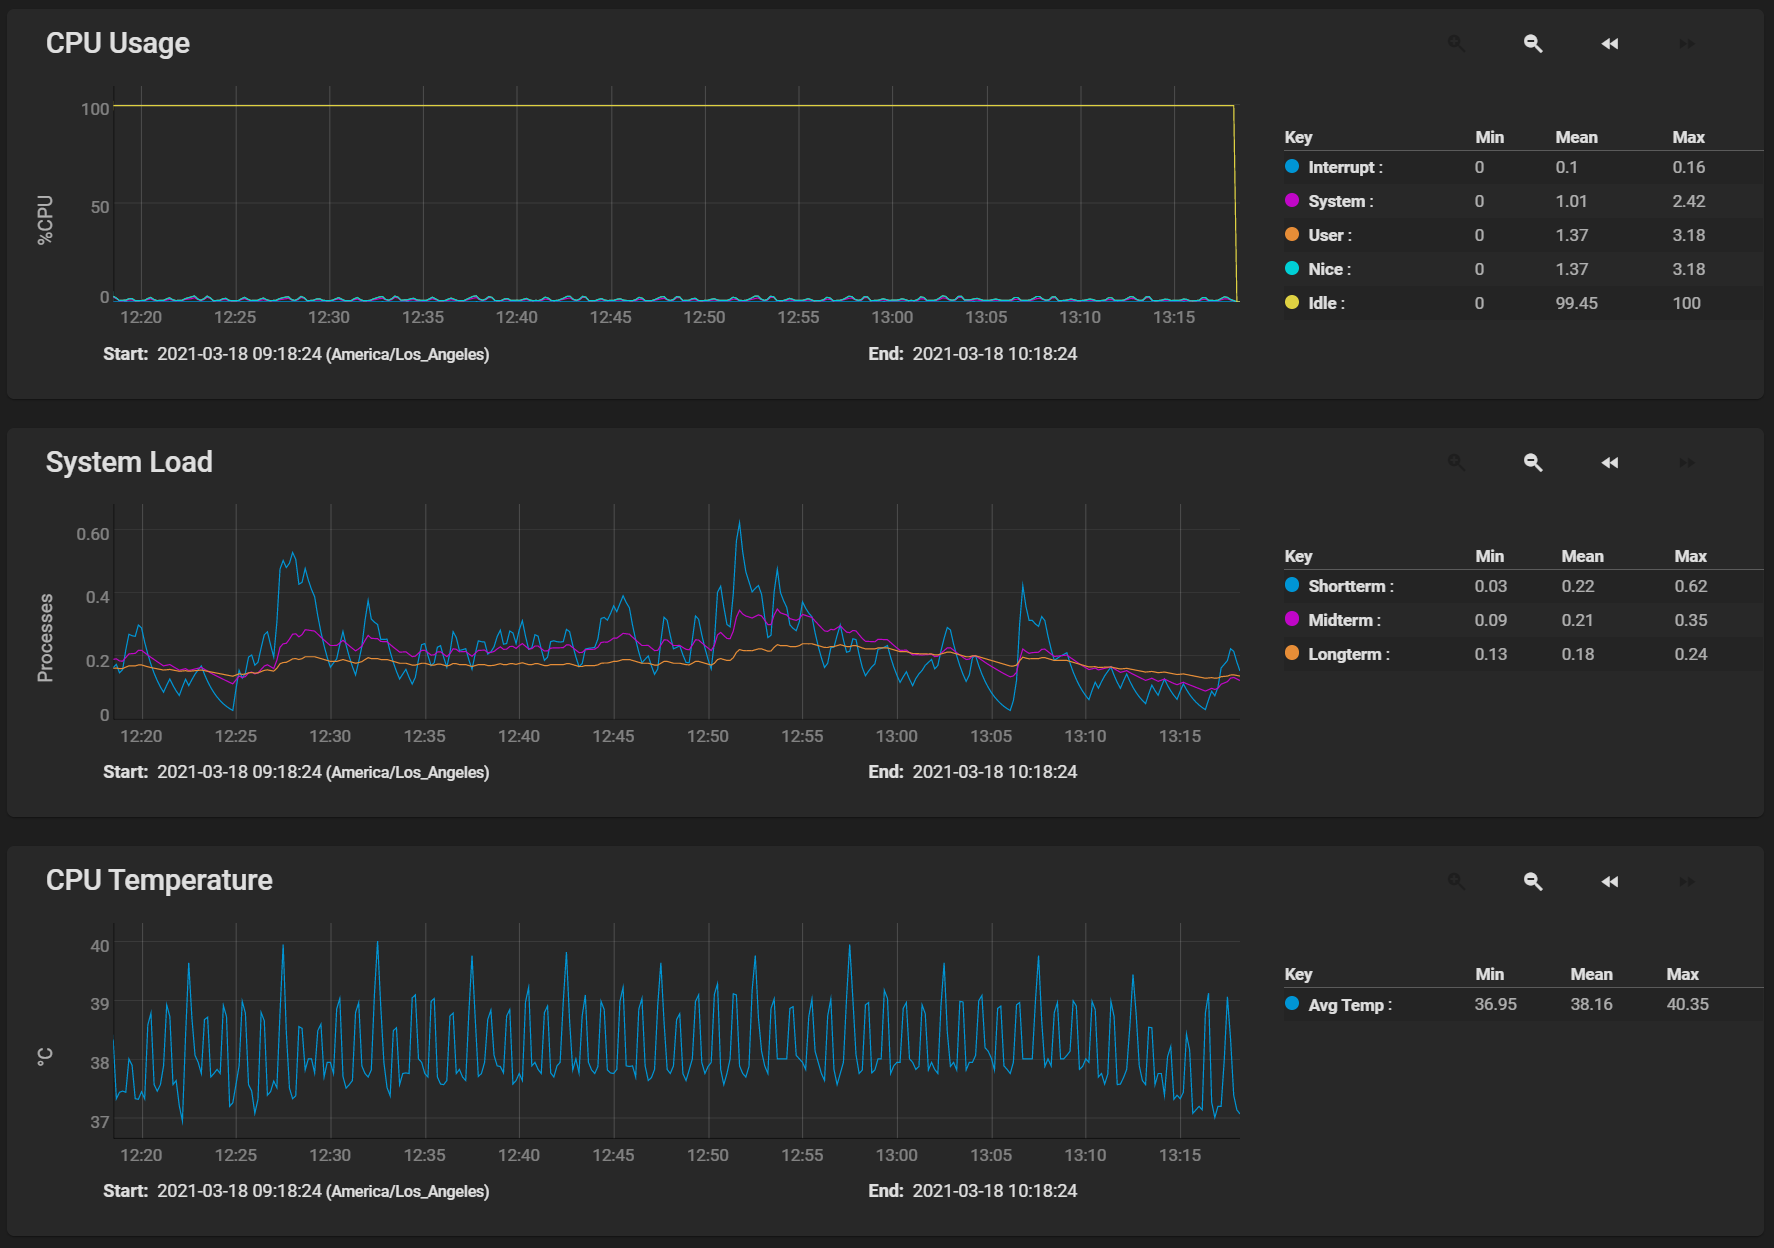
| CPU | Displays the CPU Temperature, CPU Usage, and System Load graphs. |
| Disk | Displays graphs for each disk in the system. |
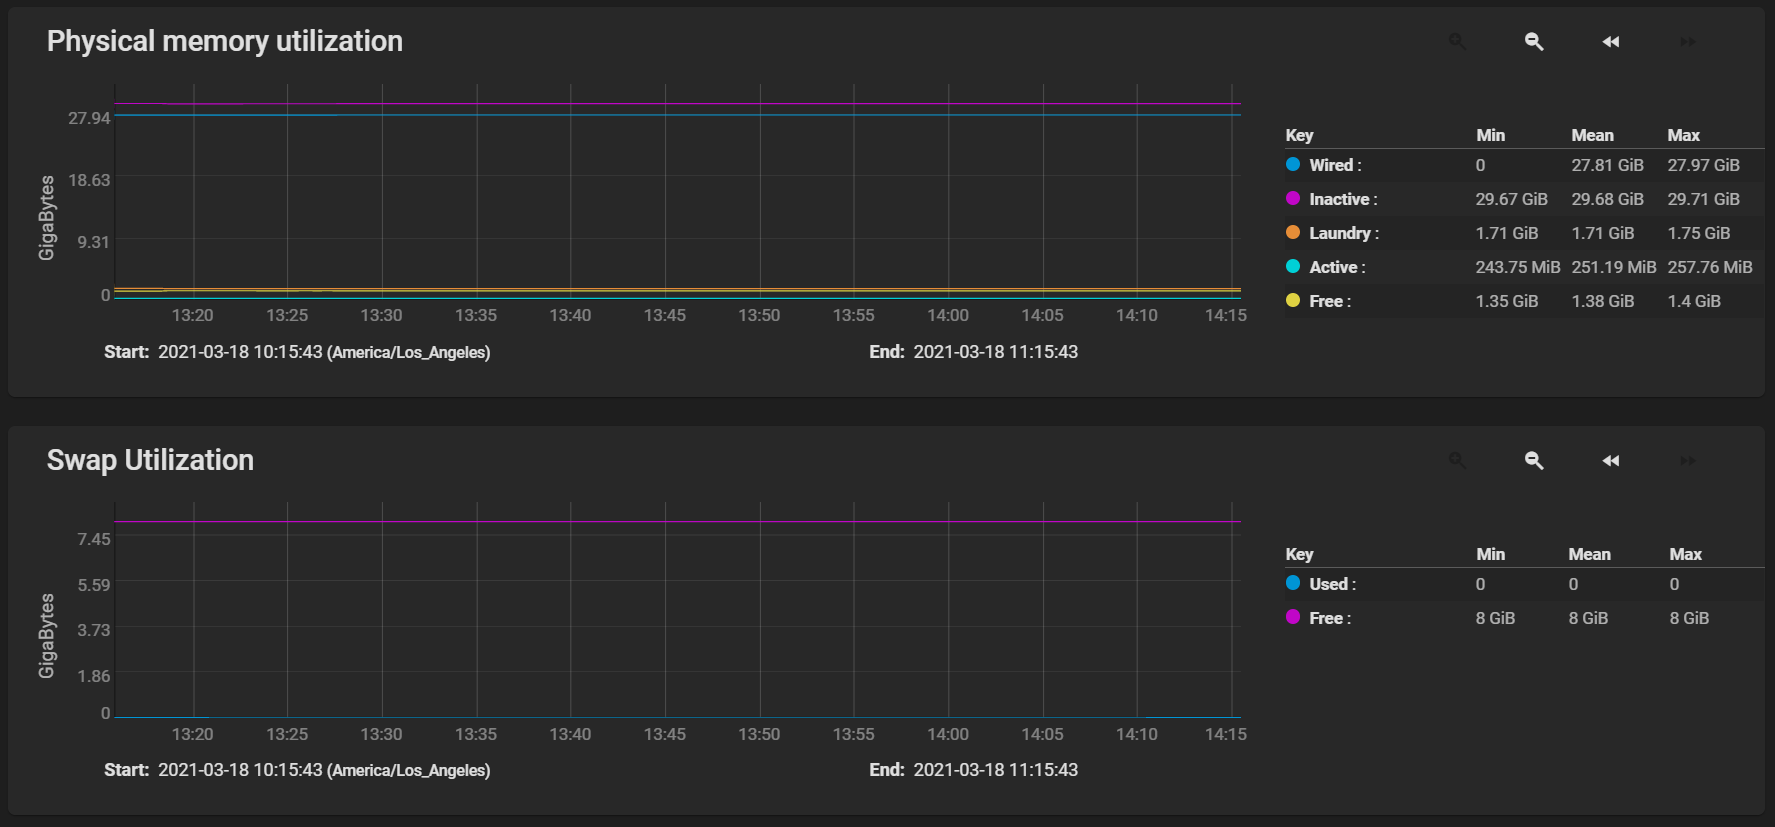
| Memory | Displays both the Physical memory utilization and Swap utilization graphs. |
| Network | Displays an Interface Traffic graph for each interface in the system. |
| NFS | Displays the NFS Stats (Operations) and NFS Stats (Bytes) graphs. |
| Partition | Displays graphs showing disk space allocations. |
| System | Displays both the Processes and Uptime graphs. |
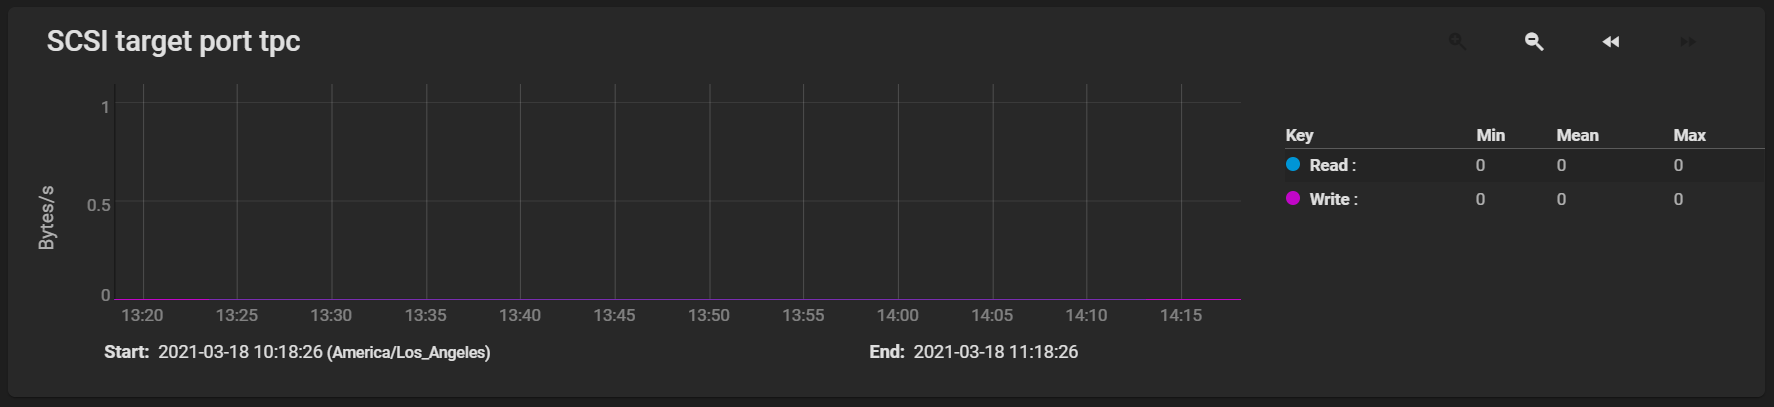
| Target | Displays graphs only for systems with iSCSI ports configured and shows the bandwidth statistics for iSCSI ports. |
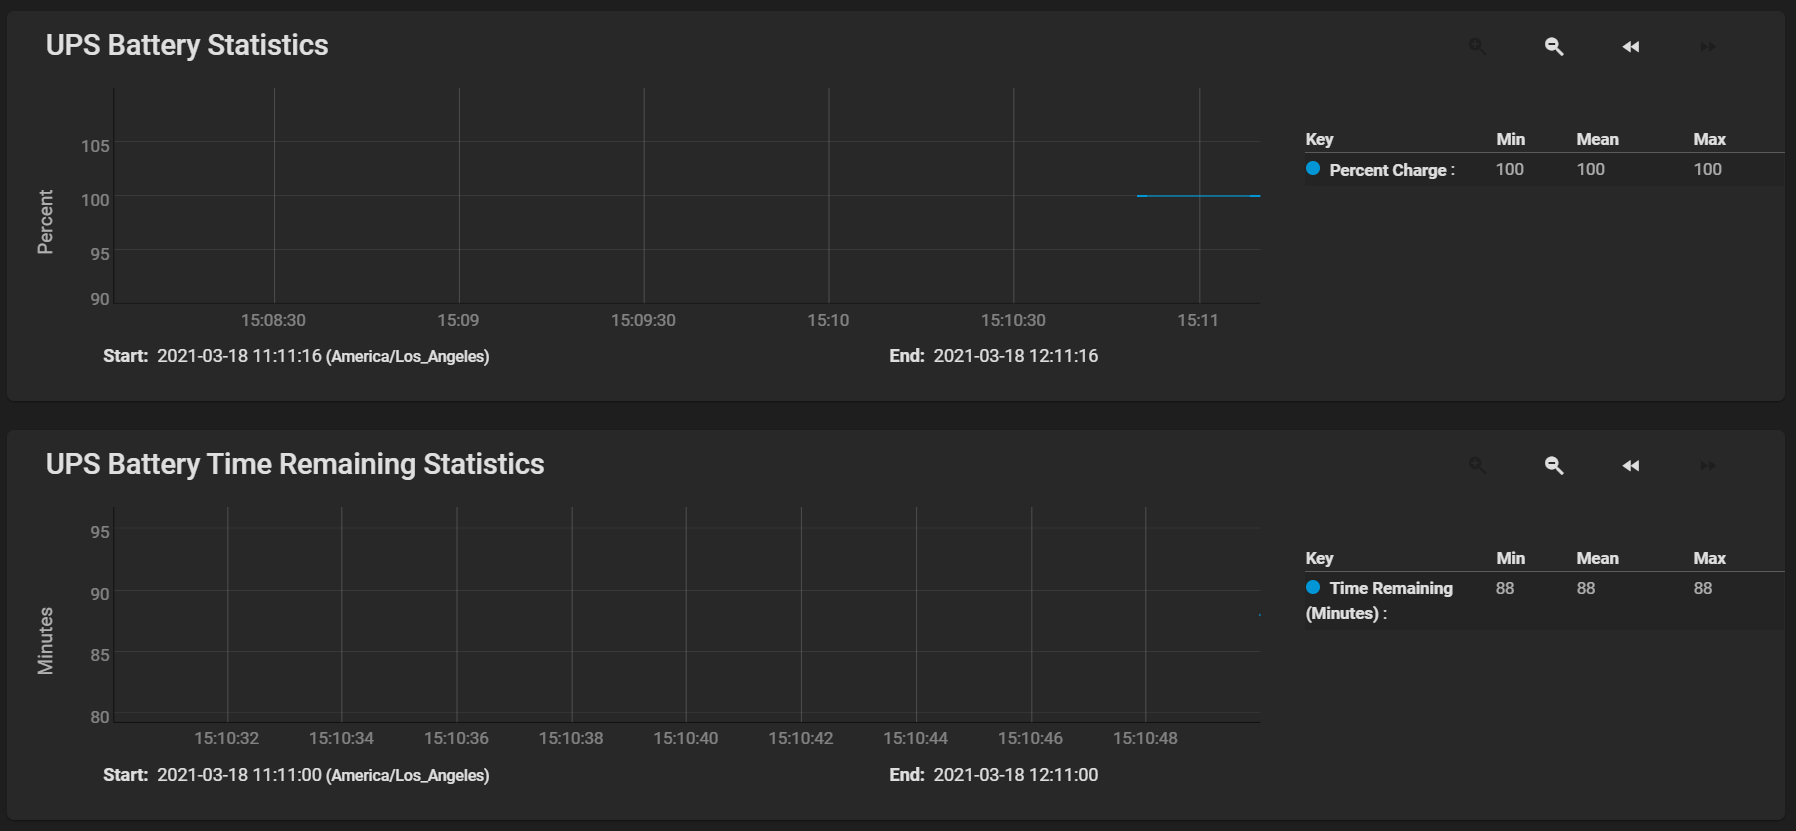
| UPS | Displays the graphs only if the system is configured for and uses a UPS. |
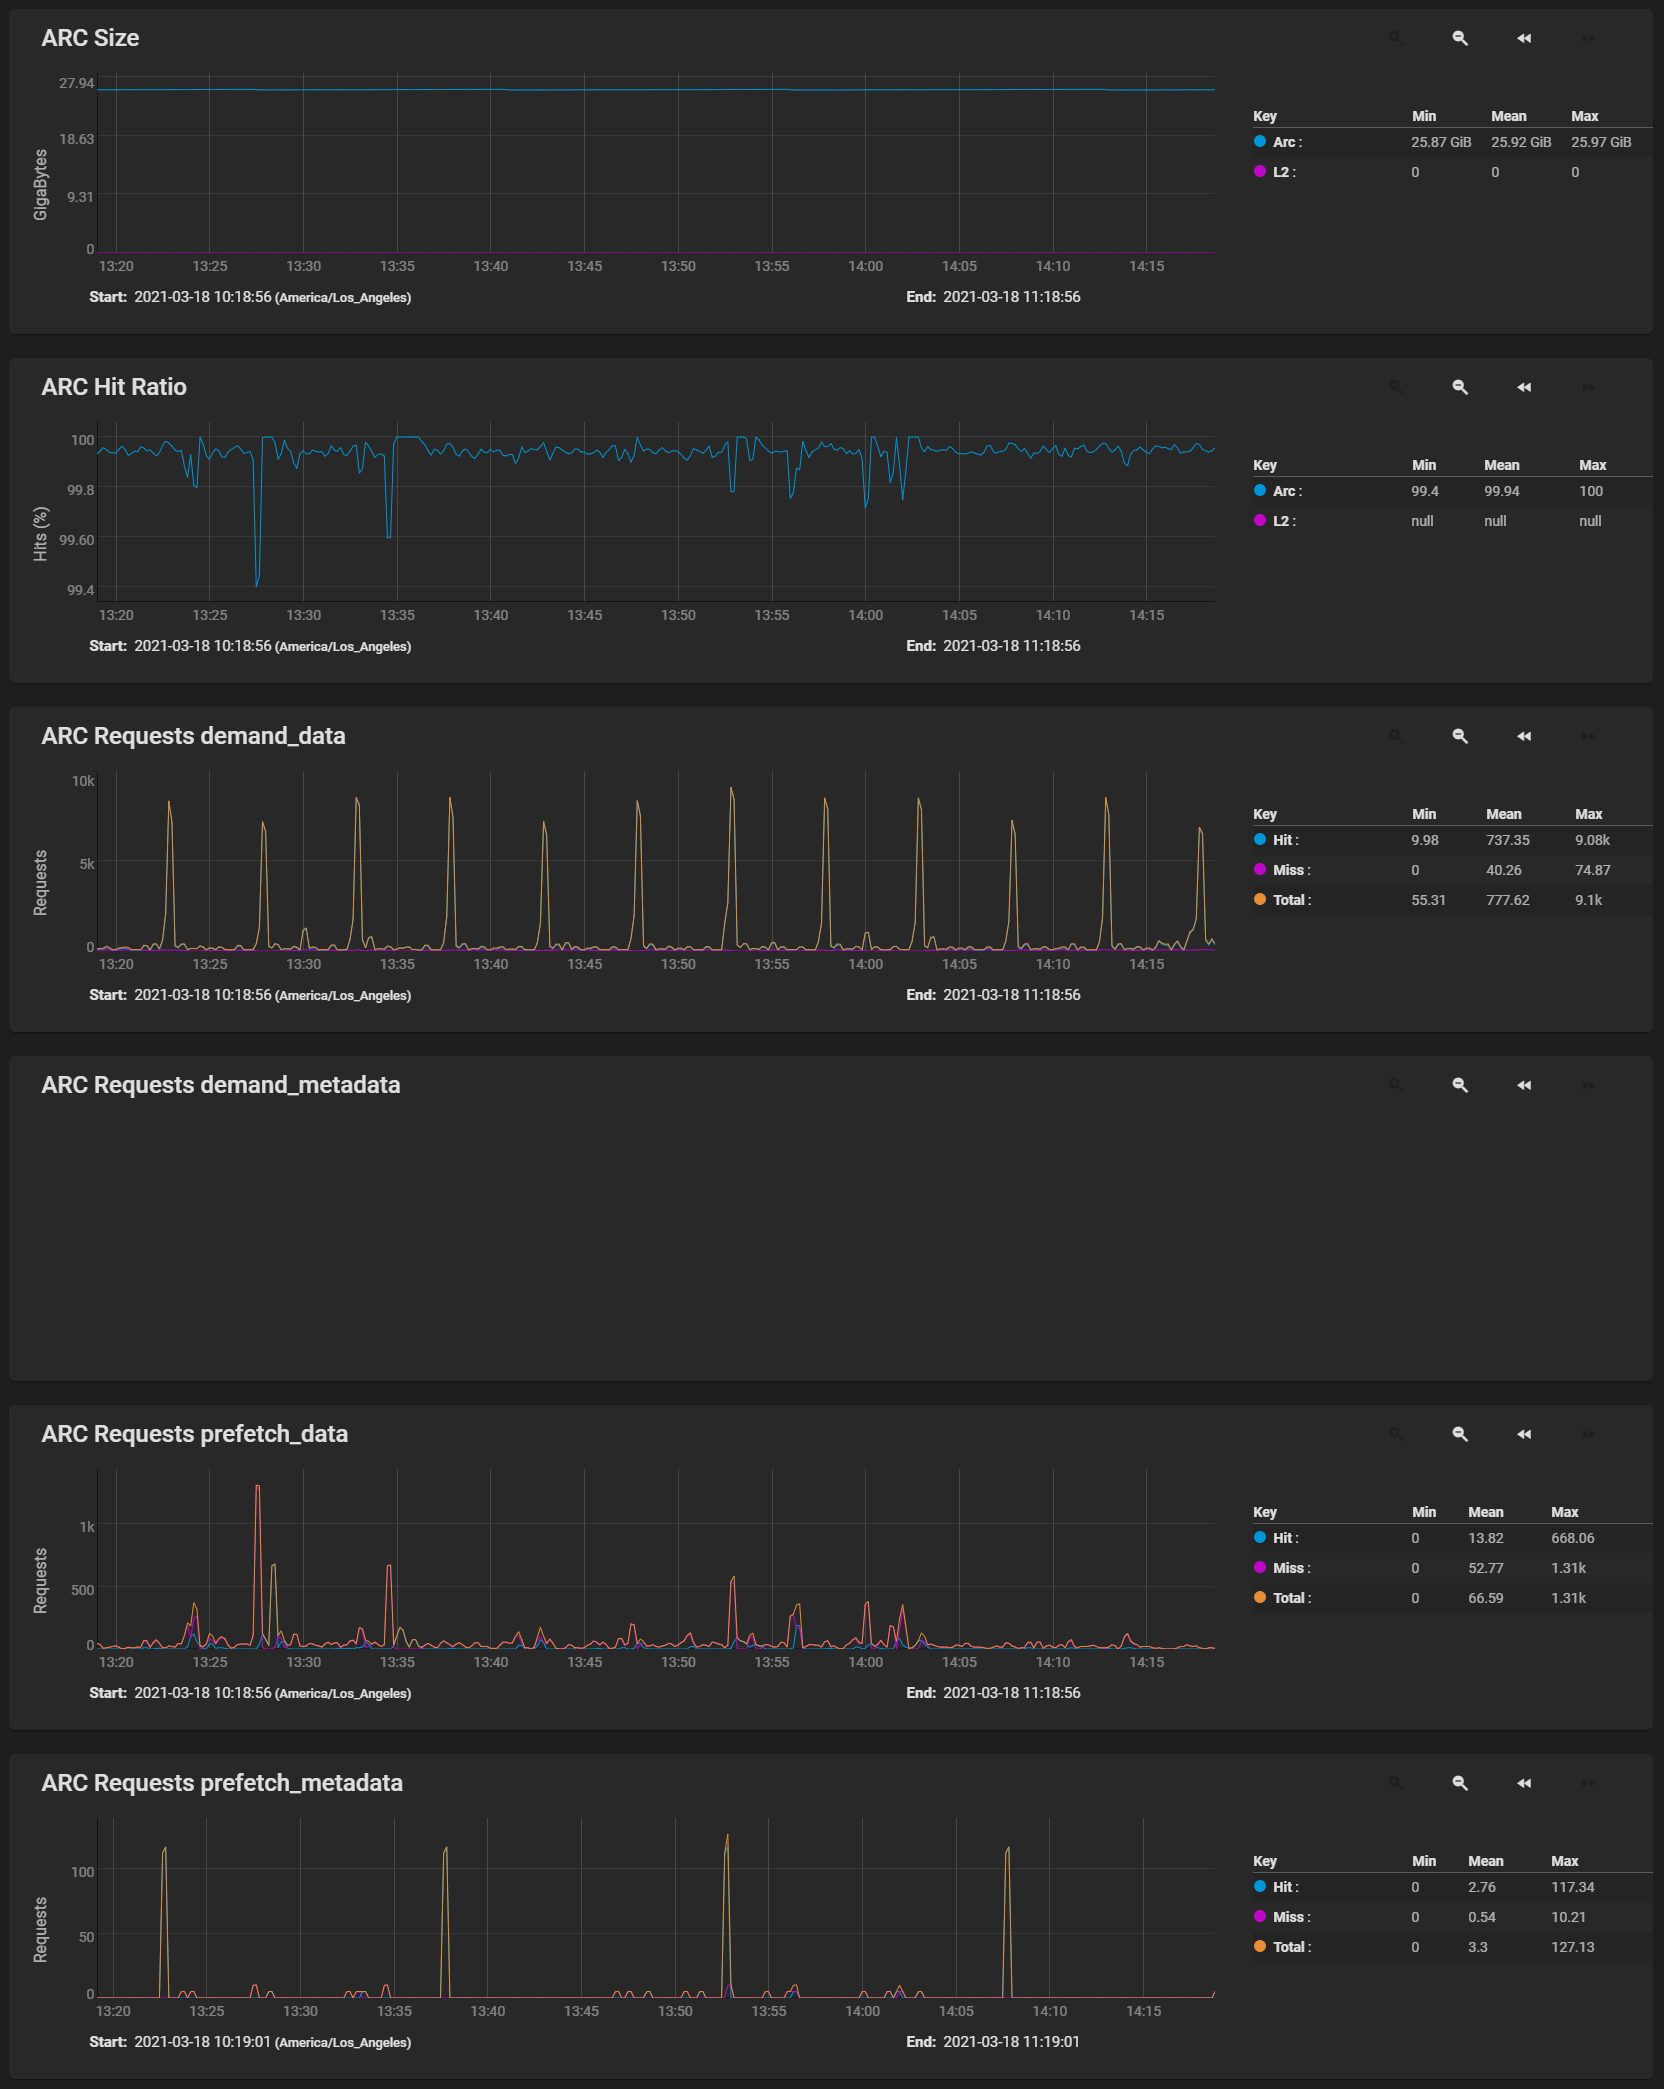
| ZFS | Displays the ARC Size, ARC Hit Ratio, ARC Requests demand_data, ARC Requests demand_metadata, ARC Requests prefetch_data, and ARC Requests prefetch_metadata graphs with the Arc and L2 gigabytes and hits (%), and the hits, misses and total number of requests. |
Interacting with Graphs
Click on and drag a certain range of the graph to expand the information displayed in that selected area in the Graph. Click on the icon to zoom in on the graph. Click on the icon to zoom out on the graph. Click the to move the graph forward. Click the to move the graph backward.
Graphs
CPU Graphs
CPU graphs show the amount of time spent by the CPU in various states such as executing user code, executing system code, and being idle. Graphs of short-, mid-, and long-term load are shown, along with CPU temperature graphs.
Disk Graphs
Diskgraphs show read and write statistics on I/O, percent busy, latency, operations per second, pending I/O requests, and disk temperature. Use the Devices dropdown list to select one or all system disks for which you want to display a graph. Use the Metrics dropdown list to select one or all disk measurements to display.

Disk Metrics Options
| Setting | Description |
|---|---|
| Select All | Displays all available graphs for any or all disks selected on the Devices dropdown list. |
| Disk Temperature | Displays the minimum, maximum, and mean temperature readings for the disk selected. |
| Disk Busy | Displays what percentage of the selected disk is busy. |
| Disk Latency | Displays the disk latency in time (msec) for read, write and delete operations. |
| Disk Operations detailed | Displays the read, write, and delete operations for the selected disk. |
| Pending I/O | Displays then length of pending I/O requests for the selected disk. |
| Disk I/O | Displays the disk read and write I/O stats in bytes/s. |
Important
Temperature monitoring for the disk is disabled if HDD Standby is enabled. Check the Storage > Disks Edit Disk* configuration form for any or all disks in the system if you do not see the temperature monitoring graph.
Memory Graphs
Memory graphs display memory usage and swap graphs display the amount of free and used swap space.
Network Graphs
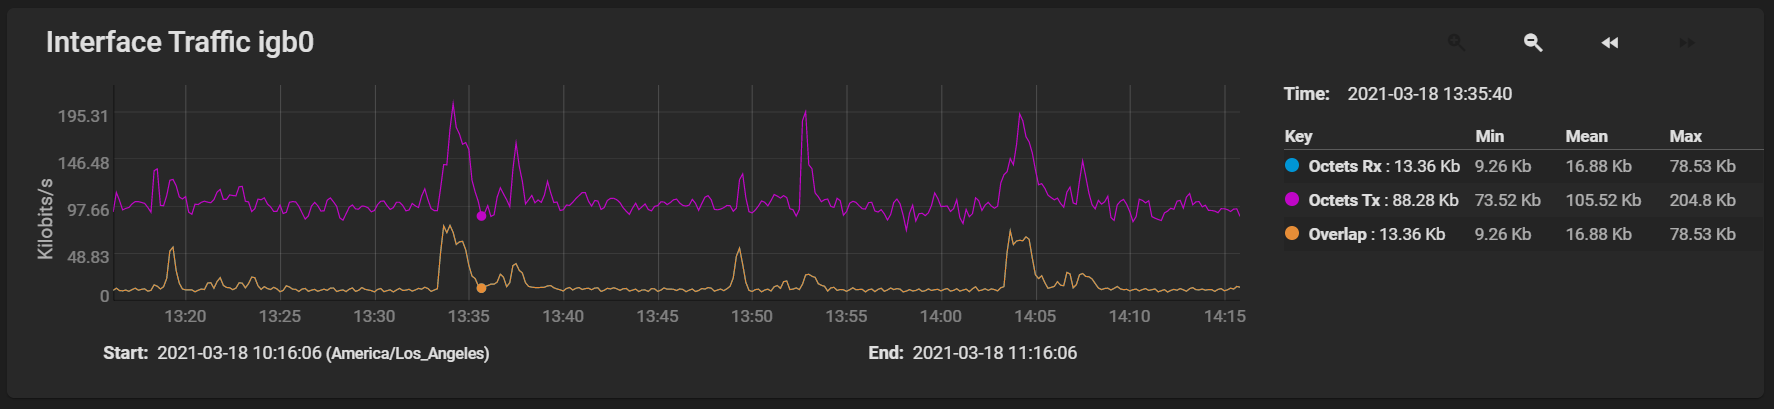
Network graphs report received and transmitted traffic in megabytes per second for each configured interface.
NFS Graphs
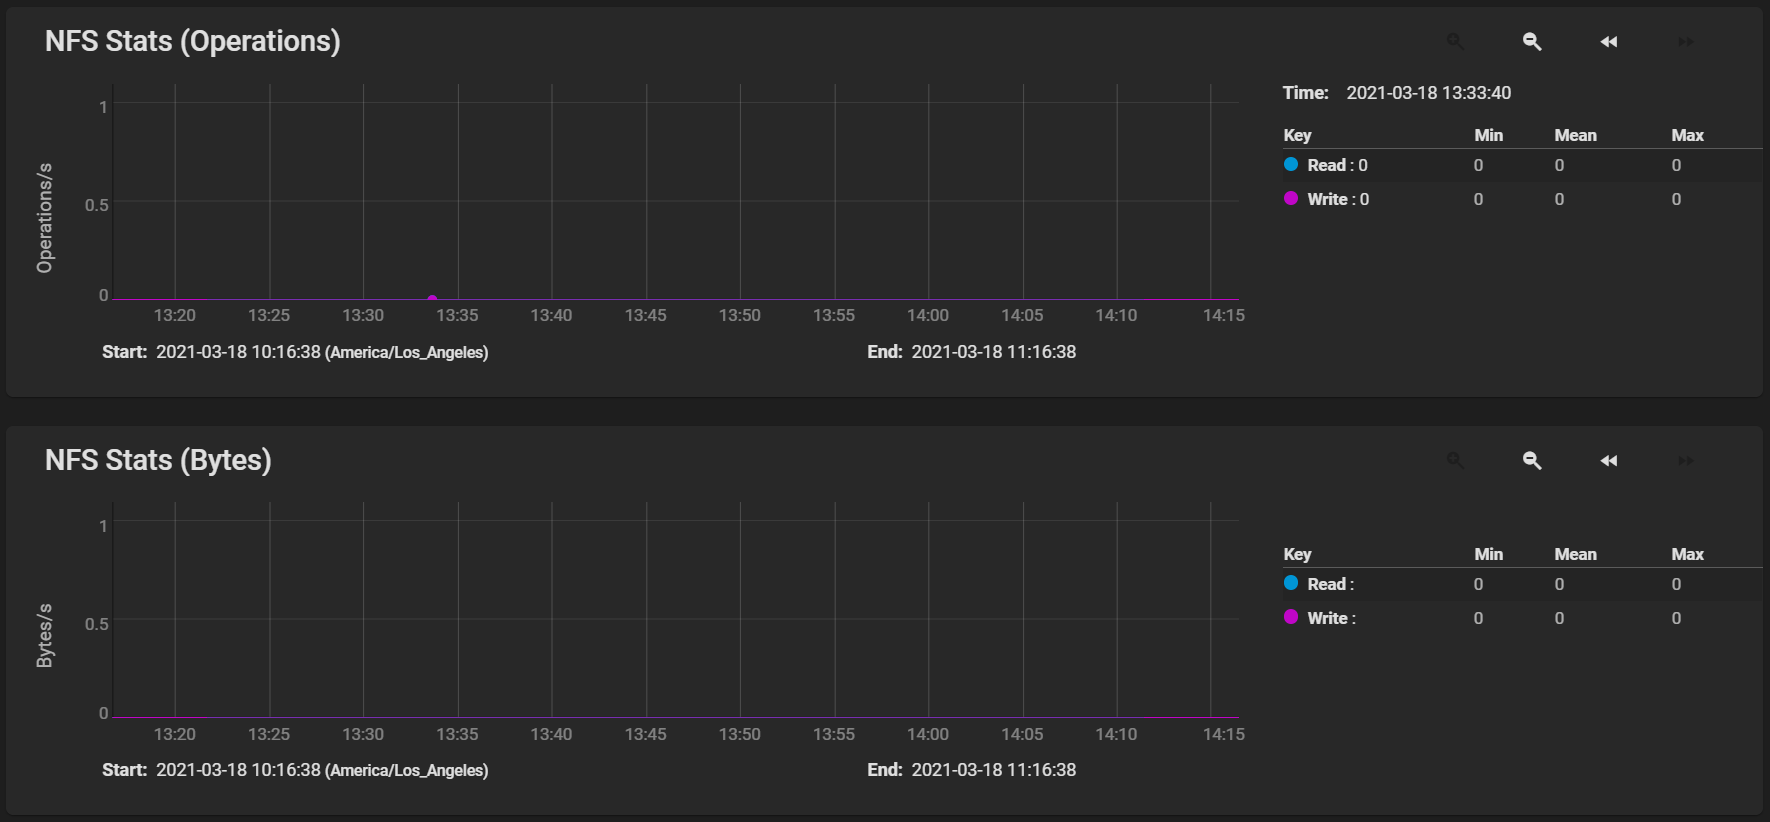
NFS graphs show information about the number of procedure calls for each procedure and whether the system is a server or client.
Partition Graphs
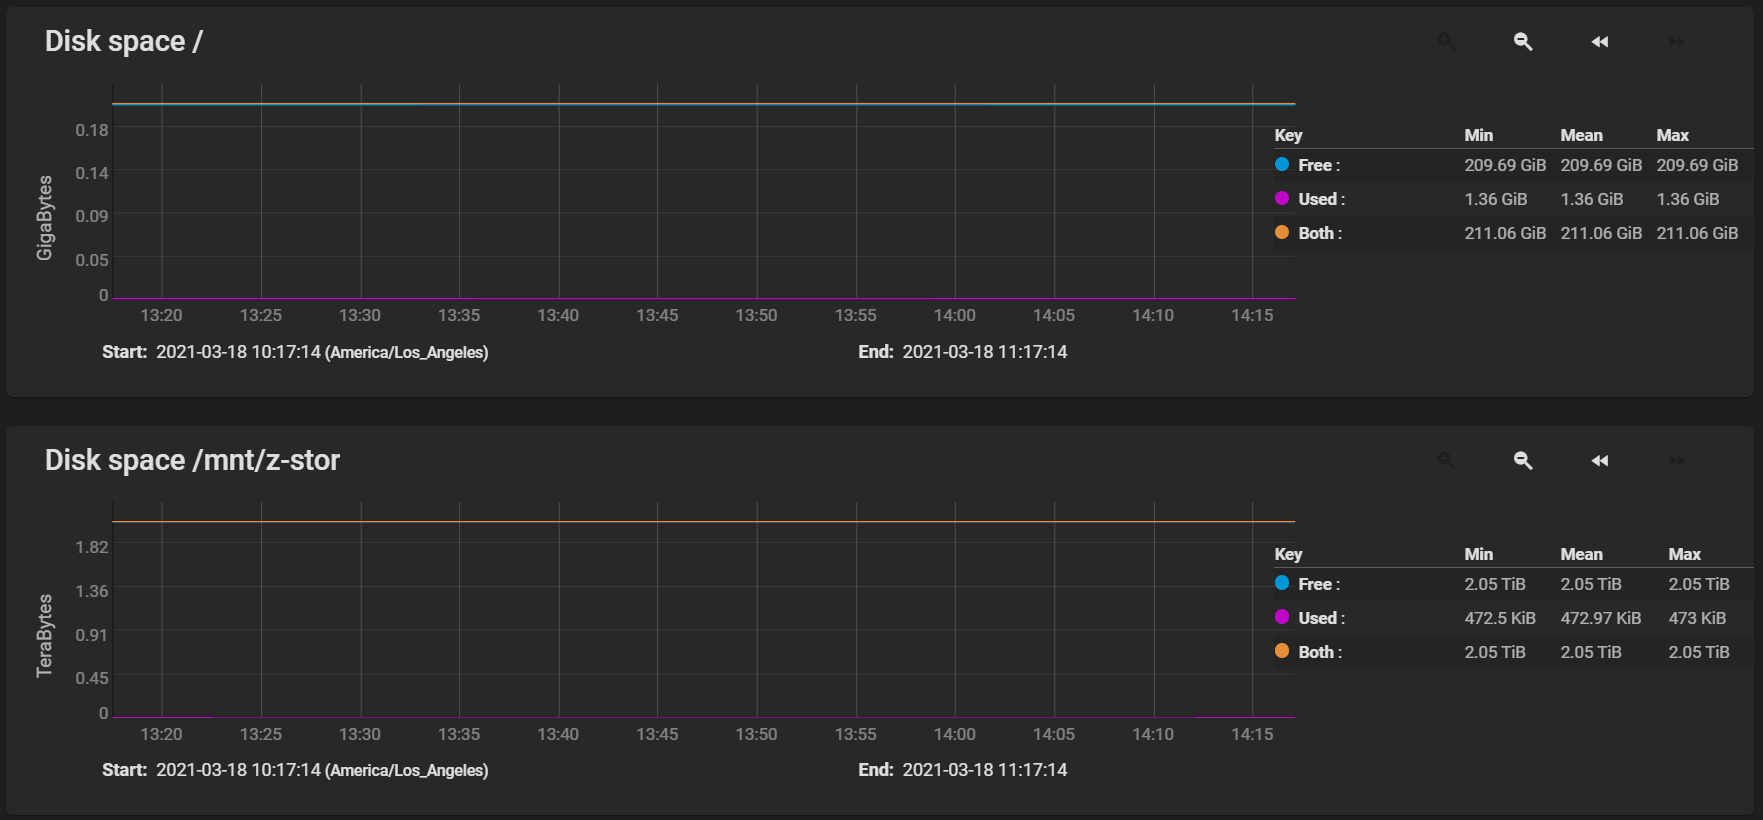
Partition graphs display free, used, and reserved space for each pool and dataset. However, the disk space used by an individual zvol is not displayed as it is a block device.
System Graphs
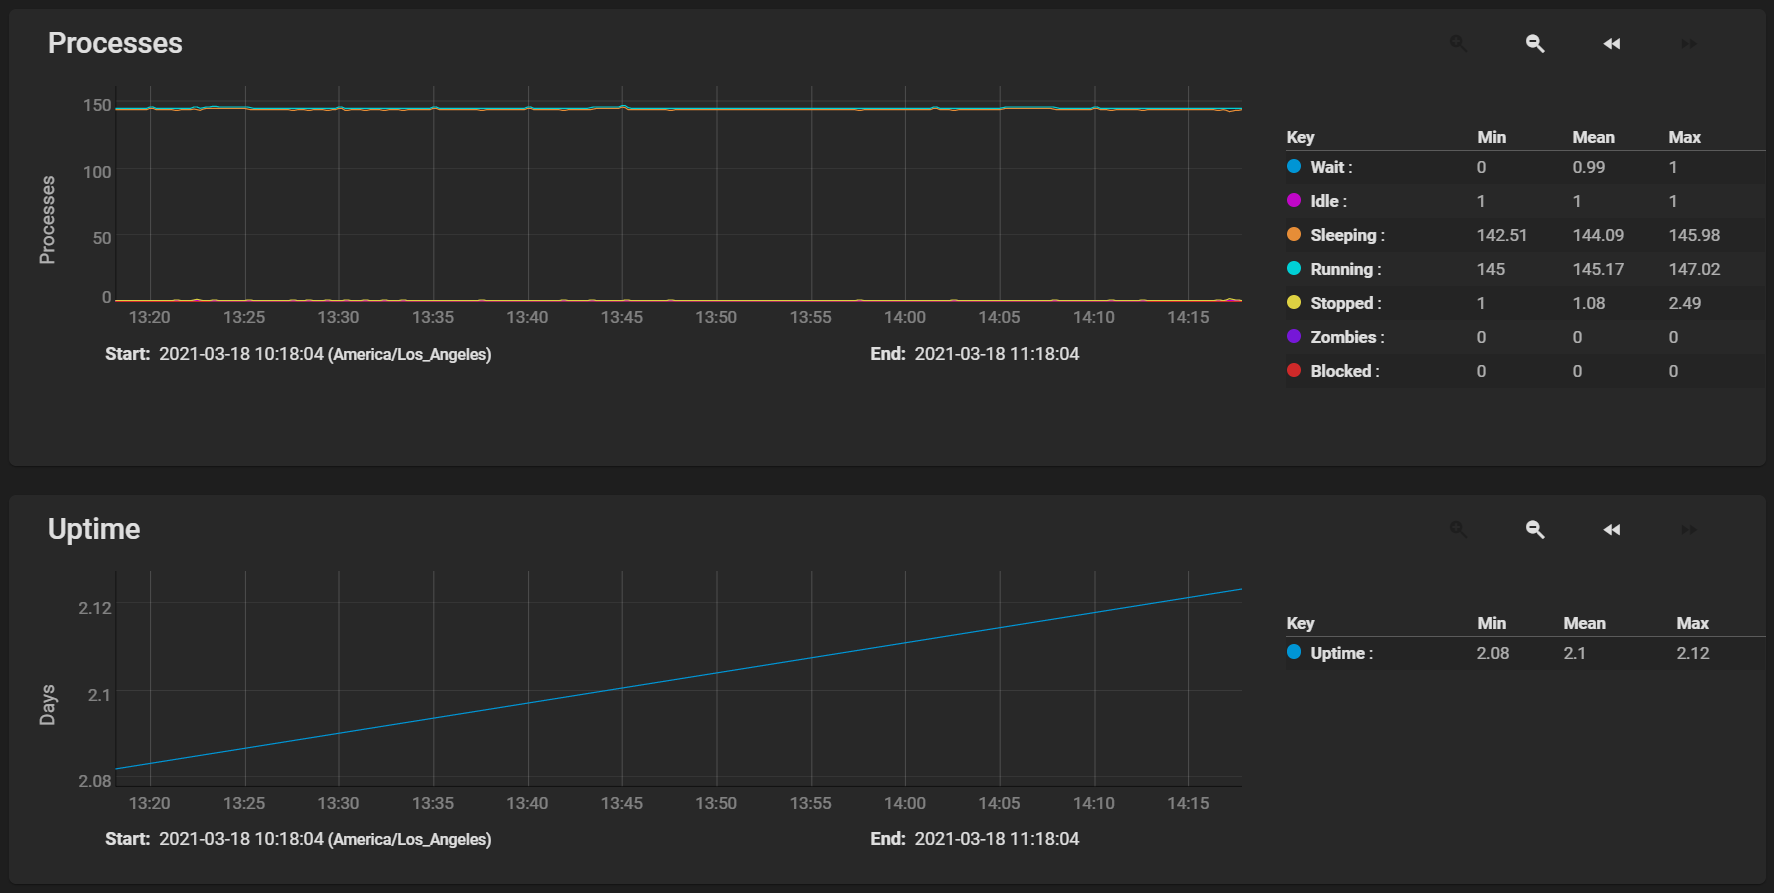
System graphs display the number of processes. It is grouped by state.
Target Graphs
UPS Graphs
UPS graphs show statistics about an uninterruptible power supply (UPS) using Network UPS tools. Statistics include voltages, currents, power, frequencies, load, and temperatures.
ZFS Graphs
ZFS graphs show compressed physical ARC size, hit ratio, demand data, demand metadata, and prefetch data.